
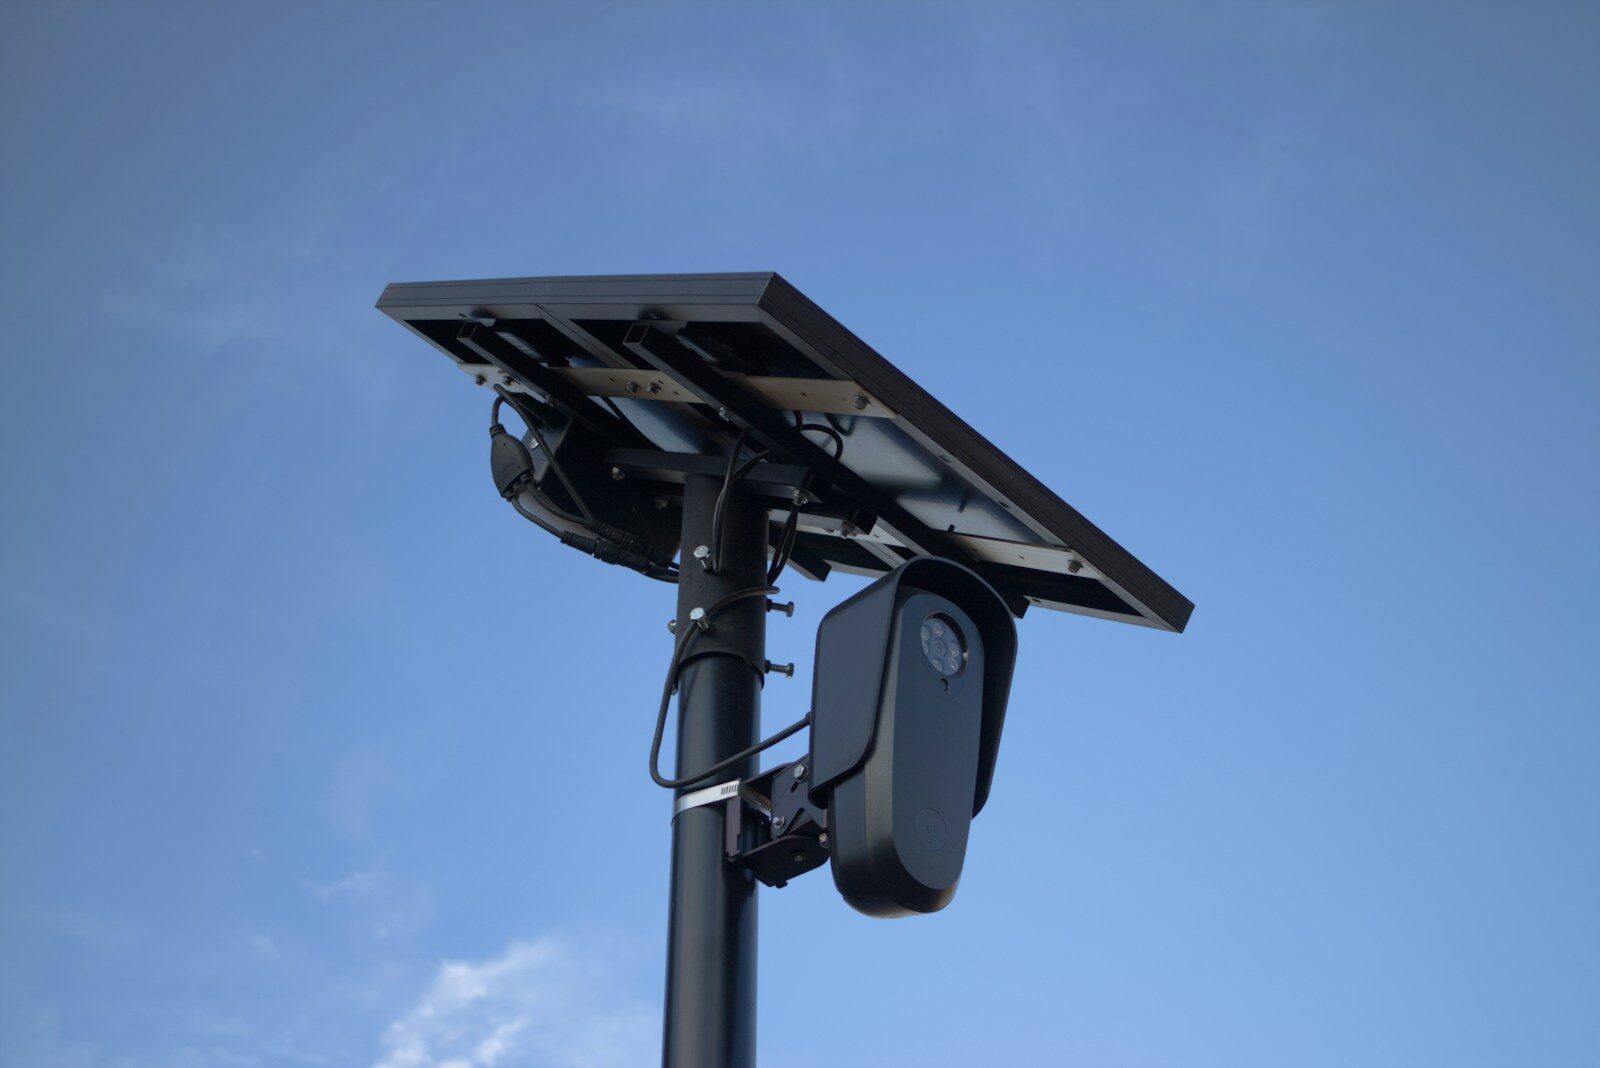
Flock Safety, the license-plate-reader company, published a blog post on August 24, 2026 headlined “Independent Study: Vehicle Thefts Fell 11% After Flock Cameras Went Live.” The post summarizes a real academic working paper, and most of its headline numbers are accurate as far as they go. But comparing the company’s summary against the underlying paper shows a pattern: the favorable point estimates are up front, while the uncertainty, the caveats the authors themselves flagged as serious, and an entire section of the paper on privacy and misuse are absent.
The underlying study is real, and its independence claim holds up
The paper behind the blog post is a working paper by criminologists Scott Mourtgos and Ian Adams, posted to CrimRxiv on August 14, 2026. It uses a Sun-Abraham event-study design on National Incident-Based Reporting System data from 2017 through 2023, covering 216 agencies that deployed Flock’s fixed cameras and more than 3,000 comparison agencies that had not. Flock’s FAQ states it did not fund the research and did not shape the findings, and says its role was limited to supplying deployment records and product clarifications. Nothing in the paper contradicts that account, though the authors do note a related limitation: their deployment data covers only one vendor, so some comparison agencies could have unobserved camera networks of their own.
The 11% figure is real, but it is one point on a wide range
The paper’s central estimate is an 11.0 percent decline in reported motor vehicle theft in the year after deployment. What the blog post does not mention is the 95 percent confidence interval the authors report alongside it: -17.3 to -4.2 percent. The true effect, per the study’s own statistics, could be nearly twice the headline number or well under half of it. The post also does not mention that this specific 11 percent figure depends on how agencies are weighted. The authors ran the same analysis giving every agency equal weight, and separately weighting by population, and in both of those versions the decline was smaller and not statistically distinguishable from zero. The 11 percent number is the estimate for aggregate theft volume concentrated in higher-crime agencies, not a uniform effect that shows up no matter how you slice the data.
Buyer’s guide: Best GPS Trackers for Cars in 2026
“Biggest where the problem is worst” is a description of the weighting, not a bonus finding
Flock’s post frames the concentration of the effect in high-theft jurisdictions as an added benefit: cameras “help most where the problem is worst.” The paper’s own subgroup breakdown complicates that framing. When agencies are split into thirds by pre-existing theft volume, only the lowest and highest thirds show a statistically significant decline under the study’s primary weighting, and the middle third does not. Under equal weighting, the pattern changes again: the high-volume group actually shows a small statistically significant increase, not a decrease. The authors themselves caution that this pattern should not be read as a uniform effect across departments.
The arrest-clearance number omits the study’s biggest caveat
Flock reports a 15.9 percent rise in arrests for vehicle theft, calling it a real gain, and adds in passing that “arrests had been rising before the deployment timeframe.” That undersells what the researchers actually found. Clearance rates begin climbing three months before the recorded camera deployment date, a pattern the authors call the principal threat to that estimate. They test whether the finding survives a formal sensitivity analysis for violations of the parallel-trends assumption, and report that the clearance result loses statistical significance entirely in one sample specification even with no assumed violation, and in the full sample once a modest violation is allowed. The paper is explicit that it cannot rule out that agencies were already ramping up vehicle-theft enforcement, for reasons unrelated to the cameras, before the recorded install date.
The corroborating survey is Flock citing Flock
The blog post says the academic findings are “consistent with what agencies told us,” pointing to Flock’s own 2026 Customer Census, a self-reported survey of its own client agencies. That is not independent corroboration; it is the company citing its own marketing research to support a study about its own product. Notably, the same academic paper separately criticizes this genre of evidence, describing vendor-supplied comparisons of adopters and non-adopters, including a prior Flock-published analysis, as failing to address why some agencies adopt the technology and others do not.
What the blog post leaves out entirely: recovery times and privacy
The study measured a third outcome that never appears in Flock’s summary: how quickly stolen vehicles were recovered. Across the full population of stolen vehicles, including those never recovered, the authors found no statistically detectable improvement in recovery speed at the one-day, seven-day, or thirty-day marks. Only among vehicles already recorded as recovered did they find a modest improvement, worth about seven hours off a roughly three-day median. Flock’s post highlights fewer thefts and more arrests but says nothing about this null result on recovery, arguably the outcome most directly tied to the company’s own product pitch about finding stolen cars.
More strikingly, the paper devotes an entire section to privacy and governance, stating plainly that effectiveness is not sufficient for policy and that these camera databases have documented histories of misuse, citing reporting from CNN and findings from the Virginia State Crime Commission. None of that appears anywhere in Flock’s blog post, which frames the research purely as validation of the product.
The national backdrop Flock cites is bigger than cameras alone
Flock’s post notes that motor vehicle theft has been falling nationally, linking to a National Insurance Crime Bureau release. That release reports a 23 percent national drop in 2025 and a 17 percent drop in 2024, but attributes the trend to a combination of factors: law enforcement efforts, insurer initiatives, and manufacturer security fixes, particularly software updates addressing the widely publicized Hyundai and Kia theft wave. The academic study’s own statistical design tries to isolate camera-specific effects from this broader national decline using regional and state-level controls, but Flock’s blog post presents the NICB figures as simple supporting context without mentioning that most of that national decline is explained by causes having nothing to do with license-plate cameras.
A minor citation discrepancy
Flock’s post states that “law enforcement agencies clear 1 out of every 10 reported motor vehicle thefts by arrest,” attributed to the FBI. The academic paper it is summarizing uses a different figure from the same underlying FBI data ecosystem: an 8.2 percent clearance rate for 2023, which rounds closer to 1 in 12. The gap is small and may reflect different years or reporting samples, but it is a reminder that even the framing statistics in the post do not precisely match the study’s own numbers.
Bottom line
The study Flock is citing appears to be a legitimate, methodologically serious working paper by independent academics, and Flock’s core numbers, 11 percent and 15.9 percent, are drawn accurately from the paper’s headline results. The distortion is one of omission rather than fabrication. The blog post strips out the wide confidence intervals, the weighting sensitivity that makes the topline number disappear under equal weighting, the pre-deployment rise in clearance that the authors call the principal threat to their own clearance estimate, the null result on vehicle recovery speed, and the paper’s own extended discussion of documented misuse of these camera networks. Readers who want an accurate picture of what this research does and does not show should read the CrimRxiv working paper directly rather than relying on the company’s summary of it.
Sources: Flock Safety blog, Independent Study: Vehicle Thefts Fell 11% After Flock Cameras Went Live (Aug. 24, 2026); Mourtgos, S.M. and Adams, I.T., Automated License Plate Readers, Vehicle Theft, and Clearance working paper, CrimRxiv (Aug. 14, 2026); National Insurance Crime Bureau, U.S. Vehicle Thefts Experience Historic Decline (Mar. 18, 2026); Council on Criminal Justice, Crime Trends in U.S. Cities: Year-End 2025 Update (Jan. 2026).