

The average new car price in America hit $50,562 in September, according to Kelley Blue Book and Cox Automotive data published October 13. That is up 0.9% from August, up 0.7% from a year ago, and just $52 below the all-time record of $50,614 set in December 2025. Headlines will call it a near-record. The more useful story is what that single number hides.
The headline: four straight monthly gains, but a weak year-over-year pace
Four consecutive monthly increases sounds like prices are running away. They are not. A 0.7% year-over-year gain is well under the 2% to 4% that September usually delivers, so sticker inflation is cooling even as the average creeps toward a record. The average MSRP rose to $52,342, which means the typical buyer is paying about $1,780 less than window-sticker value.
The reason the average still rises is mix. As Cox Automotive executive analyst Erin Keating put it, “Consumers don’t buy the industry average.” Her point: pressure on affordability is pushing shoppers toward cheaper vehicles and segments, which holds the overall number down even while individual segments get pricier.
What the average new car price really tells you
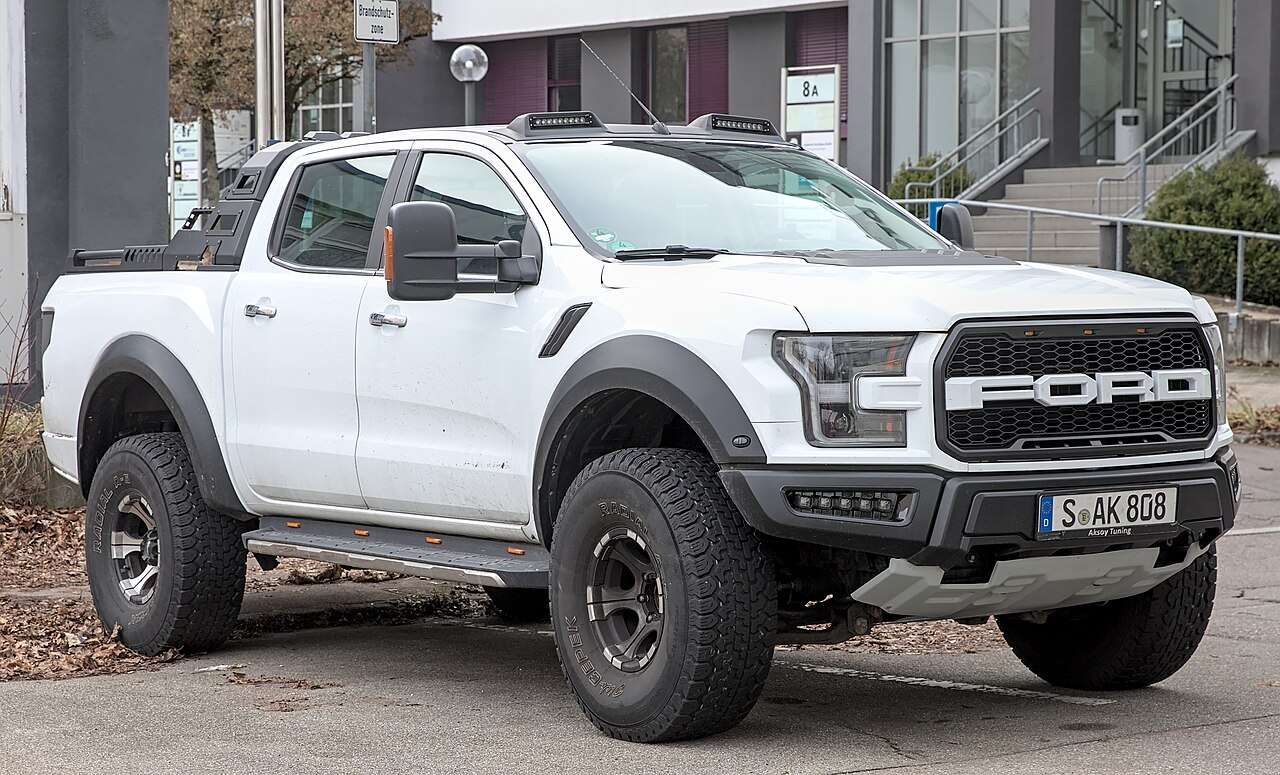
The $50,562 figure blends a $27,977 compact car, a $31,213 subcompact SUV, a $37,614 compact SUV, a $50,630 mid-size SUV and a $67,573 full-size pickup. Those five segments made up about 855,000 sales, nearly two-thirds of September volume. Nobody actually shops at the midpoint of that spread.
The segment details are where the real signal is. Compact SUVs, the most popular family vehicle, averaged $37,614, down 0.4% from a year ago, so the most common purchase got slightly cheaper. Compact cars rose 3.2% to $27,977, the fastest increase of the five, which shows that even entry-level buyers are not getting relief. Full-size pickups rose 1.5% and mid-size SUVs 2%.
Incentives are shrinking as a share of the price
Incentives averaged $3,359 per vehicle, or 6.6% of the average transaction price. That is up slightly from 6.5% in August but well below the 7.3% a year earlier, and the dollar amount is down 8.8% year over year. Automakers are spending less to move metal. For buyers it means the discount you can expect off a typical new vehicle is smaller than it was last fall, so negotiating on rebates alone will get you less than it used to.
That squeeze lands on top of financing costs. Our earlier look at why car payments just hit a September record of $821 while prices barely moved explains where the money went when prices barely moved. With car loan rates looking cheap right now but the bond market signaling that will not last, getting a loan pre-approval before you walk into a dealership is worth more than chasing a small rebate.
Electric vehicles: cheaper than last year, but still a premium
The average EV sold for $55,879 in September, up from a revised $54,574 in August but 3% lower than a year ago. EVs carried an 11% premium over gas-powered and hybrid models, steady all year and down from roughly 18% on average in 2025. Incentives on EVs fell to 11% of the transaction price, the lowest level of 2026 and well below 14.2% a year earlier. In other words, the sticker gap is shrinking, but the discounts that closed it are fading.
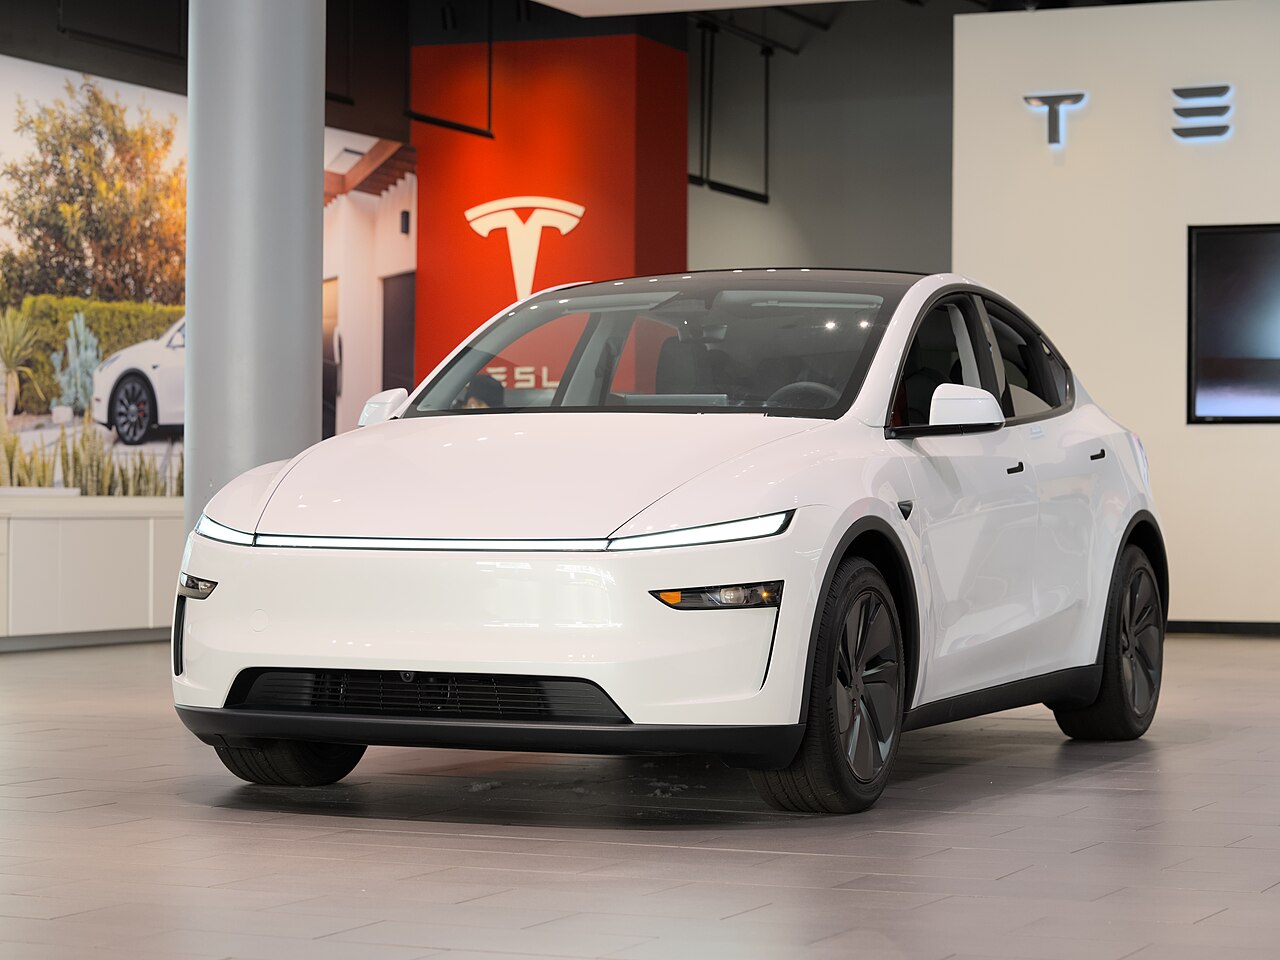
Tesla’s average transaction price was $54,345, up 3.3% from August. The Model 3 and Model Y made up nearly 97% of its sales. If you are comparing powertrains, read our breakdown of how AAA ran EVs, hybrids and gas cars through the same cost math, and see why higher Tesla prices and bigger charging hubs affect the real cost of ownership.
What it means for drivers and buyers
First, ignore the average. Look up the transaction price for the specific model and trim you want, not the industry figure. Second, the gap between MSRP and what people pay is about $1,780 on average, so a quote at full sticker is a signal to keep shopping. Third, compare total monthly cost, including rate and term, rather than the headline price. Finally, if you carry debt on an older vehicle, remember that a repossession does not necessarily erase a subprime loan balance.
What it means for the industry
The near-record average, paired with falling incentive spending, suggests automakers are protecting margins rather than chasing volume, while shoppers trade down to stay inside a budget. That is a fragile balance. Tariffs are a wildcard: Trump’s planned 50% Canadian car tariff set to start January 1 could push costs higher just as buyers are running out of room. If mix keeps shifting toward cheaper vehicles, the average may stall even if every individual price rises. If it does not, the $50,614 record could fall soon.
Source: Kelley Blue Book / Cox Automotive, September 2026 Average Transaction Price report, published October 13, 2026.